T he Baltimore Ravens are preparing to start their fourth quarterback this year, Jacoby Brissett, against the beleaguered Los Angeles Chargers on Monday, because of injuries to Lamar Jackson, Tyler Huntley and Joe Fagnano. That puts them dangerously close to the NFL record of five within a single season (a record shared by the 1984 Bears and 2023 Browns when excluding the 1987 strike season).
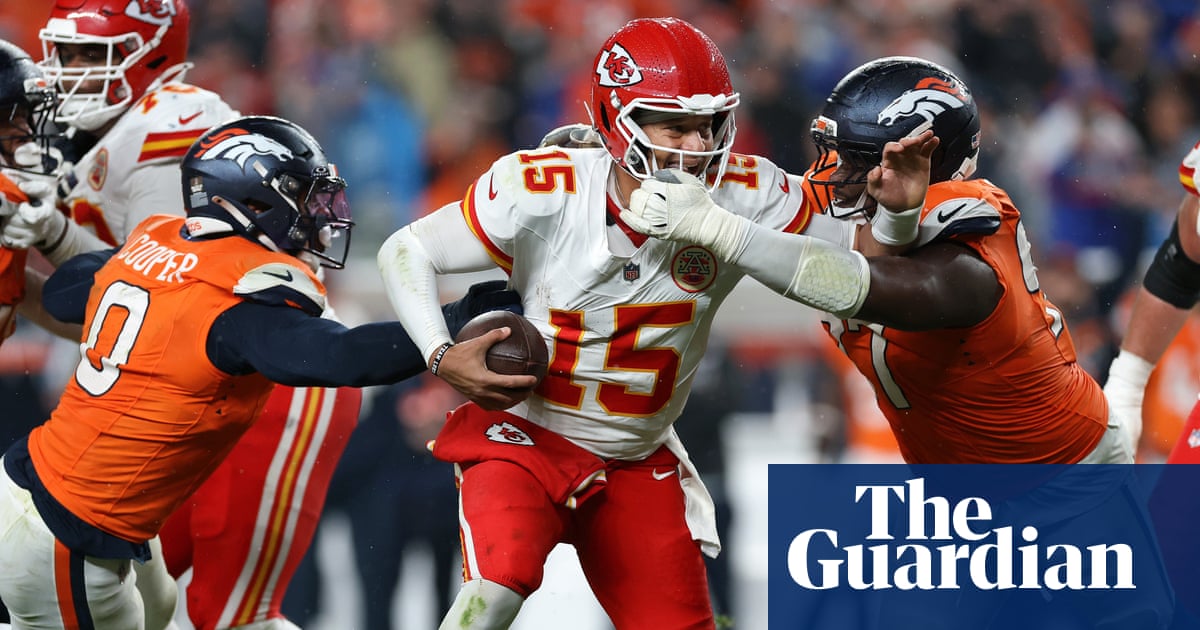
Jackson, Huntley and Fagnano were all injured after taking hits in games. And if it seems like quarterbacks are taking punishment more often this year, your eyes aren’t deceiving you. Through nine weeks, quarterbacks have been hit on 15.1% of their dropbacks, the most we’ve seen since 2006, when hits were first logged in official box scores.
That may be why more quarterbacks have started games through nine weeks in 2026 than in almost any other year in recent memory. This year’s 47 starters only fall behind 2019 (48 through nine weeks), 2010 (48) and 2007 (49) over the past 20 years, and the expected starts for Carson Beck, Kyle McCord and Fernando Mendoza will push the total up further.
It turns out that, despite all the advantages offenses have been given over the years, defenses are better at pressuring the quarterback than at any other time in recent NFL history.
Pro Football Focus has measured the pressure rate this year at 36.1%, the highest in their dataset going back to 2006. Sports Info Solutions’ dataset goes back to 2016, and this year’s rate is the second-highest by their count, falling just behind 2025. Next Gen Stats’ data goes back to 2018 and finds something similar: the third-highest in their dataset, just slightly below 2023 by 0.1%.
So, quarterbacks are under seemingly more pressure than ever. But why?
One may think it’s because offensive line play has declined. This has been a talking point for years – the theory goes that the best athletes go to the defensive side of the ball, more football happens in seven-on-seven and in camp environments, development is a dying art, etc.
But it’s hard to look at the top offensive linemen in the NFL and argue they’re any worse than in previous eras. I’d put Trent Williams, Penei Sewell, Creed Humphrey, Quenton Nelson, Tristan Wirfs and Jordan Mailata against almost any other period’s top linemen. Quantitatively, we haven’t seen offensive line pass-block win rates – either from PFF or ESPN’s measures – change much over the years. This measure, along with its mirror, pass-rush win rate, tells us how often a pass protector loses their rep within the first 2.5 seconds of play. That may not result in pressure because the quarterback could be getting rid of the ball, pass protection help could arrive or the quarterback is just too far away from the pass rusher to be affected, but it does give us a better snapshot of how a player executed their assignment than just “pressure”.
The bottom of the NFL performance charts for offensive linemen isn’t meaningfully different from previous years either; the lowest PFF grades to offensive linemen are actually higher now than they have historically been. Again, that matches the eye test – watching underperformers this year like Austin Jackson and Cam Jurgens, one would have difficulty arguing that their play is remotely comparable to the mediocrity we saw from John Michael Schmitz Jr in 2023 or Scott Quessenberry and Kenyon Green in 2022.
So where else should we look for a reason behind the rise? It could be that blitz rates are peaking – and not just because the Vikings are doing so at absolutely obscene rates . The median team’s blitz rate is higher than we’re used to seeing, too. But it’s not the highest we’ve ever seen. Median blitz rates were higher in 2009, 2010, 2011, 2013, 2014, 2019 and 2020. The pressure rates on blitzes this year are a little high (42.7%), but not drastically so. This only accounts for a small percentage of the noticeable uptick in pressure. We’re also seeing the rise in pressure even when we’re only looking at unblitzed downs.
There’s also little evidence that this uptick is due to inherent talent increasing on the pass-rushing side of the ball. Pass-rush win rates haven’t increased this year. In fact, they’re lower than ever. On top of that, quick pressure rates – that is, how often pressure appears in under 2.5 seconds – are the same as they’ve always been.
So, if it’s not more blitzing, poor offensive linemen, or better pass rushers, what is it?
Quarterbacks are holding on to the ball longer than ever before. The average time to throw is 2.83 seconds, the longest it’s been since the stat has been charted. This isn’t a product of quarterbacks extending plays after pressure arrives, either – clean-pocket time to throw is higher than it’s ever been (2.45 seconds, up from an average of 2.38 over the previous 10 years).
The share of dropbacks lasting 2.5 seconds or longer is 57.6%, again the highest we’ve ever seen. This is significant; dropbacks over 2.5 seconds have historically been pressured at a 50.5% rate, while quick dropbacks see a pressure rate of just 16.6%.
One could point to the increasing prevalence of scrambling passers like Caleb Williams, who leads the league in time to throw. We can think of scramblers as quarterbacks most likely to extend plays after the pocket breaks down or attempt to run for yardage more often. About 45% of quarterback dropbacks in the NFL fit that criteria today. In 2009, that number was 10%. Not only that, throws on the run have increased (12.5% of all throws compared to 7% in 2022), as have throws outside the pocket.
That’s one contributing factor, but time to throw for non-scramblers is up, too – the highest rate in the dataset at 2.81 seconds on average.
Are offenses dropping back deeper in the pocket and attempting to dial up shot plays downfield? Sort of. Dropback depth has steadily increased over the years after dipping substantially in the late 2010s, with the share of dropbacks setting up nine yards away from under center increasing.
This explains some of the recent increase, but it can’t explain the pressure differences we’re seeing against 2010s- or 2000s-era offenses, where dropbacks were deeper than they are now.
Instead, offenses want to throw deep but can’t. Average depth of target has actually decreased over the years. This most recent five-year stretch is the shallowest in our throw-depth data.
Part of that is the decrease in man coverage (usually “Cover 0” with no safety help up top and “Cover 1” with one safety deep) and single-high safety shells (In addition to Cover 1, this includes “Cover 3” with one safety and two cornerbacks deep).
Teams are parking two safeties up top (Cover 2 and Cover 4) and deterring deep shots at a greater rate than any other time in the past 20 years. We can see this on the play-to-play level; teams throw over 20 yards against Cover 4 at a 9.1% rate and Cover 2 at a 10.3% rate.
But Cover 0 is at 10.7%, Cover 3 at 11.5% and Cover 1 at 14.8%. The expansion of these two-high looks over the past several years has meant that teams going big-game hunting have to turn down their deep shots for checkdowns and other shallower routes.
On top of that, coverage is getting better. Quarterbacks are declining their first read much more often – according to both FTN Fantasy and the PFF QB annual, the lowest rate in the last six years (which is as far back as this charting goes) and that almost always means a shorter pass because the first reads on plays tend to be the explosives.
We can also see this improvement in coverage in another way: Next Gen Stats logs something called “tight-window throws”, where throws are made with the defender within one yard of the receiver. That tight-window rate is at its highest since 2020. Contested targets (logged by both FTN and PFF) are up as far back as the data goes – 52.4% of targets this year have been contested. Only one other season in PFF data has a rate over 50% (2024 – 50.1%).
So why is quarterback pressure increasing? Part of it is because quarterbacks are better at extending plays and invite pressure when they do so. Part of it has to do with a slight increase in blitz rates. Part of it has to do with natural variance in how the game evolves. But most of it? NFL teams are better at stopping deep passes.